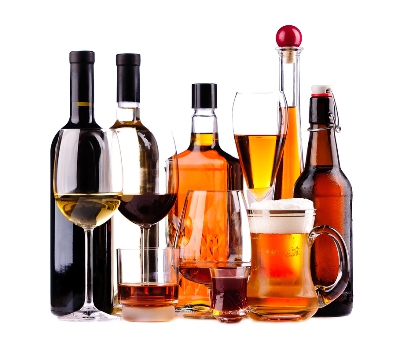
"Across all alcoholic beverages, there were 9.9 litres of pure alcohol available for consumption in 2012-13 for every person in Australia aged 15 years and over," said Louise Gates, Director of Health from the ABS.
"This is the lowest level since the mid-1990s."
The decrease is mainly due to a continuation of the downward trend in apparent consumption of beer, at the same time as a flattening out in wine consumption.
"In terms of pure alcohol, consumption of beer has more than halved since the peak in the mid-1970s, and is now at the lowest level since 1945-46.
"For wine, there has been a steady increase in people's consumption over the long term but recently this trend appears to have plateaued, and in fact, per person consumption of wine has decreased slightly over the past three years.
"Ready-to-drink beverages have also seen a drop over the past five years, while consumption of spirits has remained relatively steady," said Gates.
However, beer still comprised the greatest proportion of all pure alcohol consumed in Australia at 41 per cent, followed by wine (37 per cent), spirits (13 per cent), and ready-to-drink beverages (7 per cent). Cider is estimated to account for a small but growing proportion, at 2 per cent.
In 2012-13 there were 75.1 million litres of pure alcohol available for consumption in Australia in the form of beer, a decrease of 0.6 per cent from 2011-12 (75.6 million litres).
Summary
There were 183.6 million litres of pure alcohol available for consumption from alcoholic beverages in Australia in 2012-13. This was 0.2 per cent more than the amount available for consumption in 2011-12 (183.3 million litres).
The volume of pure alcohol available for consumption in the form of spirits increased by 4.1 per cent between 2011-12 and 2012-13. The volume of pure alcohol available for consumption in the form of Ready to Drink (pre-mixed beverages) decreased by 2.9 per cent, beer by 0.6 per cent and wine by 0.5 per cent during this period.
Of all pure alcohol available for consumption in 2012-13, beer contributed 40.9 per cent, wine 37.4 per cent, spirits 13.1 per cent and RTDs 6.6 per cent. Cider contributed a further 2.0 per cent (see paragraphs 25 to 36 of the Explanatory Notes for information on how estimates of cider were calculated).
On a per capita basis there were 9.9 litres of pure alcohol available for consumption per person in 2012-13, 1.6 per cent less than the amount in 2011-12 (10.0 litres) and 8.2 per cent less than 2007-08 (10.8 litres). As a standard drink consists of 12.5mls of pure alcohol, this is equivalent to an average of 2.2 standard drinks per day per person aged 15 years and over.
Note that these figures will overestimate the true level of alcohol consumed as beverages, as adjustments cannot be made for wastage and other factors such as for alcohol used in cooking.
Beer
Full strength beer made up 82.1 per cent of all beer available for consumption in 2012-13, followed by mid strength beer (14.3 per cent) and low strength beer (3.6 per cent). In 2007-08, full strength beer accounted for 82.0 per cent of all beer, followed by mid strength beer (12.0 per cent) and low strength beer (6.1 per cent).
The volume of beer available for consumption decreased 1.8 per cent between 2011-12 and 2012-13, from 1,762.4 million litres to 1,730.1 million litres. The volume of full strength beer decreased 2.4 per cent while low strength beer decreased 9.4 per cent. Mid strength beer recorded an increase (up 3.7 per cent).
Wine
The quantity of pure alcohol available for consumption in Australia in the form of wine decreased 0.5 per cent between 2011-12 and 2012-13, from 69.0 million litres to 68.7 million litres. White wine made up 47.2 per cent of all pure alcohol in wine in 2012-13, while red wine made up 37.7 per cent and other wines 15.1 per cent.
The volume of wine available for consumption decreased by 0.5 per cent, from 543.7 million litres in 2011-12 to 541.1 million litres in 2012-13. Red wine and other wines both recorded increases during this period (2.4 per cent and 2.0 per cent respectively), while white wine decreased by 3.1 per cent. This was the first decrease in the volume of white wine available for consumption since 2001 (the first year for which data is available for wine by type).
Spirits and ready to drink (pre-mixed) beverages
The quantity of alcohol available for consumption in the form of spirits (excluding RTDs) increased by 4.1 per cent between 2011-12 and 2012-13, from 23.1 million litres to 24.0 million litres. The quantity of alcohol available for consumption in the form of RTDs decreased by 2.9 per cent during this period, from 12.5 million litres to 12.1 million litres.
Cider
In 2012-13 there were an estimated 3.6 million litres of pure alcohol available from cider (see paragraphs 25 to 36 of the Explanatory Notes for information on how estimates of cider were calculated).
Long-term trends
Over the past 50 years, levels of apparent consumption of different alcoholic beverages have changed substantially. In particular, the proportion of pure alcohol available for consumption in the form of beer has decreased considerably, from 75 per cent in 1962-63 to 41 per cent in 2012-13.
Over the same period the proportion of wine has increased from 12 per cent to 37 per cent, and spirits (including RTDs) from 13 per cent to 20 per cent.
Cider made up 2.0 per cent of the total quantity of pure alcohol available for consumption in Australia in 2012-13 (assumed using self-reported alcohol consumption data from the 2007-08 and 2011-12 National Health Surveys; see paragraphs 25 to 36 of the Explanatory Notes for information on how estimates of cider were calculated).
In terms of apparent consumption of pure alcohol per capita, total consumption has fluctuated over the past 50 years. From the early 1960s onwards apparent per capita consumption increased steadily, peaking at 13.1 litres of pure alcohol per person aged 15 years and over in 1974-75. Apparent per capita consumption remained relatively steady for the next 5-10 years, then declined over the following decade, reaching 9.8 litres per person in 1995-96.
Apparent consumption then gradually increased to 10.8 litres in both 2006-07 and 2007-08, before declining over the past 5 years to 9.9 litres of pure alcohol per person in 2012-13.
- Suppliers
- New to HospitalityHub? Book a Demo
- Advertise with us
- Login
- Email Marketing
- Buyers
- Get Quotes
- Articles & Ideas
- Login
- Subscribe to newsletter
- My Details
- Get Quotes
- Bakery & Dough Processing Equipment
- Bar Equipment & Barware
- Bathroom Fixtures & Accessories
- Chocolate Making Machinery
- Cleaning & Housekeeping
- Commercial Coffee Equipment
- Commercial Cooktops
- Commercial Fridges & Freezers
- Commercial Kitchen Equipment
- Commercial Ovens
- Dish, Utensil & Glass Washing
- Entertainment & Outdoor
- Food Packaging & Ingredients
- Food Preparation Equipment
- Furniture & Fixtures
- Pizza & Pasta Making Equipment
- Point of Sale, AV & Technology
Trusted by 200,000+ Australian hospitality buyers
Buyers
- Discover products & solutions
- Login
- Subscribe To Newsletter
- Browse All Products
- Read Articles
Suppliers
Advertise
- Promote your products & solutions
- New to HospitalityHub? Book a Demo
- Login / Forgot Password
- Advertise Your Products
- Success Stories
- Email Marketing
Trusted by 200,000+ Australian hospitality buyers


